
Introduction
Mendix drastically simplifies the software development lifecycle through abstraction. Software quality is a part of this life cycle. The most significant risk for software quality is human error; by abstracting most of the code away from the developer (through building blocks), Mendix reduces the risk of human error and improves the overall software quality. Of course, connecting these components is still risky, but way less than designing everything from scratch. Now, why is this relevant?
Custom code in Mendix and its risks
Within Mendix, you can also add custom code. What is custom code? Custom code is every instance where a developer introduces Java or Javascript actions instead of using standard platform capabilities.
Custom code is a significant risk in every Mendix application. It poses a quality risk because the responsibility of writing proper code falls on the Mendix developer instead of the Mendix platform (which is the case with platform components). Custom code can significantly impact quality, for example, using Java libraries that contain security vulnerabilities or not escaping user input resulting in the risk of malicious injection during the runtime.
Custom Code feature in CDS
Inside CDS, we’ve developed the feature Custom code that analyzes the customized high-code integrations of the Java and JavaScript actions in your Mendix application so that you get insight into your Java and JavaScript code quality. The evaluation of the code is executed through a well-known open-source code analyzer called PMD.
How it works
The moment you download a model for your revision, the custom code feature automatically starts analyzing your custom code. In a designated place (which we will show you below), CDS presents the results, providing you insight into its risk severity and coding categories like best practices, code style, and error-prone. To help you understand the potential impact of the vulnerability, we provide a link to PDM’s documentation so that you can examine how to solve the issue. Of course, we present to you the location, the specific file and the line on which the violation occurs.
Navigation & Functionality
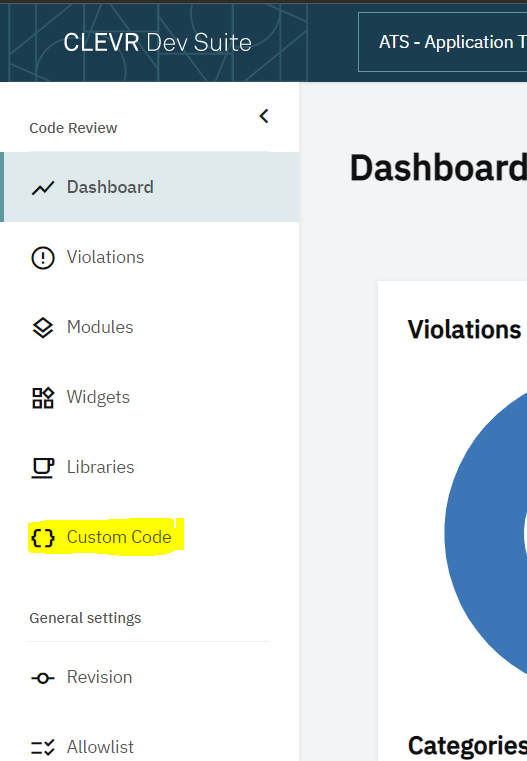
After downloading a model, you can access the Custom code feature from everywhere in CDS! Just navigate to the main menu and click on the curly brackets ({ })
When you open the Custom Code page, you see two tabs: one for Java vulneratbilities and one for JavaScript results.
Search bar
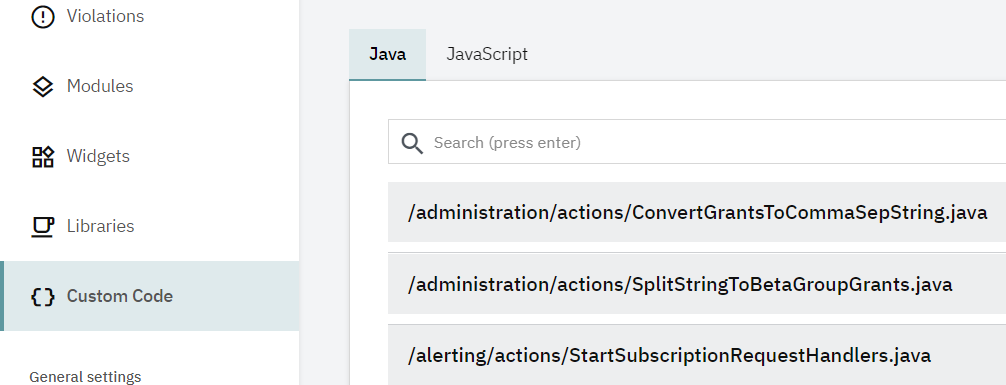
Above the results, you find a search bar that is pretty extensive! It helps you filter the results by every data item in the list. These could be the violation’s severity, categories, and keywords within rules (like “local”, “variable” or “foo”), so feel free to play around with it (and let us know what you think!). When you hit enter, you could see your results after opening the file.
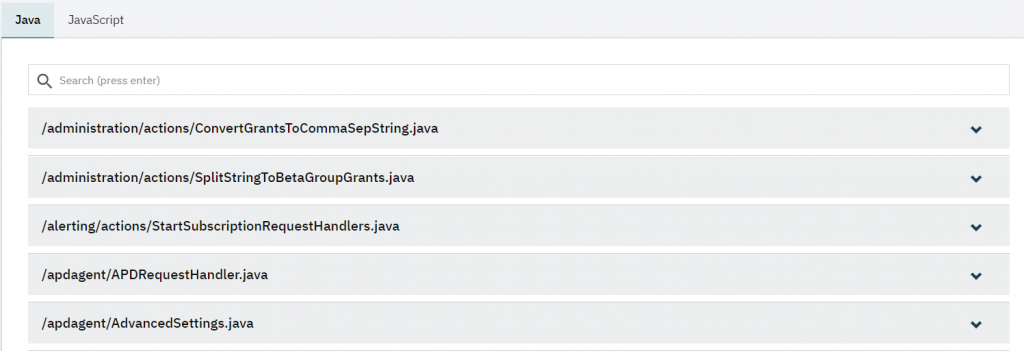
List of contaminated files
Below the search box, you see a list of files (.java or .js) that contain potential risks. The file name is presented as the path starting from the javasource or javascriptsource folder in your Mendix project, so you can easily find the concerning file.
Custom Code Violations
To open a file in the list, click anywhere on the item to expand it. It will show you violations in each of the files (Java/JavaScript actions).
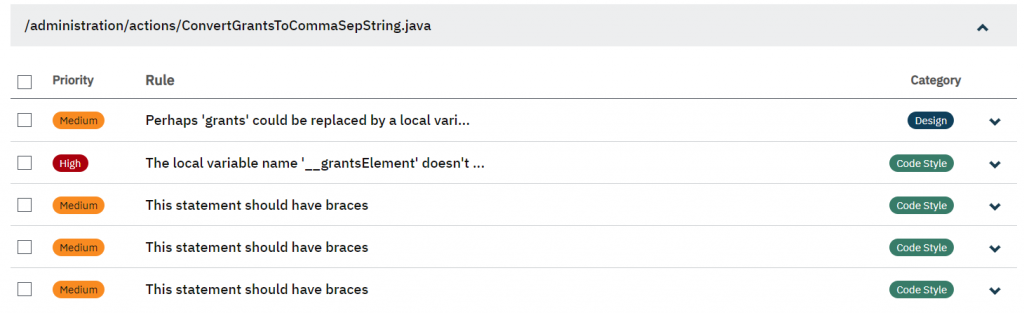
As you can see in this example, the ConvertGrantsToCommaSepString.java file has 5 violations. Each violation is presented in a list of items with information about the violation’s priority, rule, and category.
Violation Details
To see the details of a violation, simply click on them.
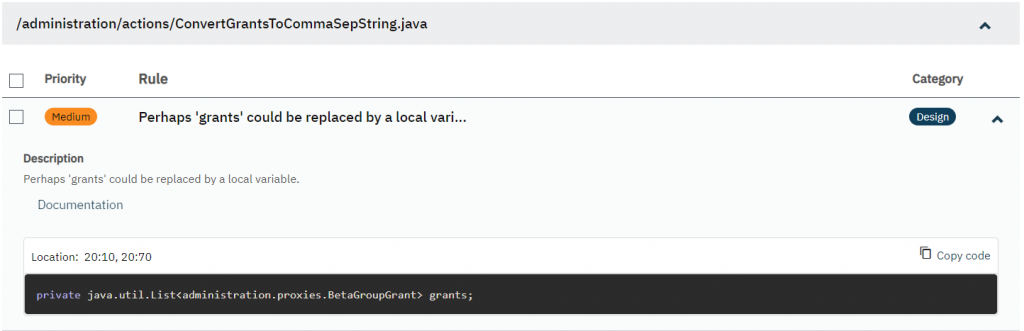
In the details section, the violation is shown in detail. Details of a violation include:
- Priority: The level of importance of the violation
- Rule: A brief description of the violation
- Category: The category of the violation provided by PMD:
 For more information about the rules and existing categories, see Java and JavaScript
- Description: Description of the specific rule
- Documentation: a reference to the rule’s category in the code analyzer’s (PMD) documentation
- Code snippet box: the place where you can see the code and its location in the file
Allowing violations via annotations
Like every violation in CDS, custom code violations can also be annotated. However, this is done a bit differently. To read the full documentation on how to suppress warnings, go to Suppressing warnings | PMD Source Code Analyzer
To provide a short overview:
Class annotation
// This will suppress all the PMD warnings in this class
@SuppressWarnings("PMD")
public class Bar {
void bar() {
int foo;
}
}
Annotate a single rule in a class
// This will suppress UnusedLocalVariable warnings in this class @SuppressWarnings("PMD.UnusedLocalVariable")
public class Bar {
void bar() {
int foo;
}
}
Annotate multiple rules in a class
@SuppressWarnings({"PMD.UnusedLocalVariable", "PMD.UnusedPrivateMethod"})
Annotate a line
public class Bar {
// 'bar' is accessed by a native method, so we want to suppress warnings for it
private int bar; //NOPMD
}